The oxygen–hemoglobin dissociation curve, or oxygen dissociation curve, relates the proportion of hemoglobin in its saturated form (SO2) on the vertical axis against the oxygen tension (pO2) on the horizontal axis. As taught in basic physiology courses it has profound clinical importance, applicable to numerous situations of health and disease, from cardiogenic shock to respiratory failure. It is fundamental to the practice of critical care as it is a major determinant of oxygen delivery. Originally explored over a century ago, there are also well-described modifiers of this curve, shifting it to the left or the right, such as the blood acidity (pH), PCO2 tension, fetal hemoglobin levels, temperature and 2,3 DPG concentrations. Its sigmoidal shape received attention by many prominent physiologists – One of the earliest mathematical descriptions is the well-known Hill’s equation, a simple equation proposed in 1910. Following this, other models have been developed. However, these equations have been derived using relatively few measurements and in a non-clinical setting. Additionally, the oxygen dissociation curve as described classically is a single curve, theoretically without any variability once the above-mentioned modifiers have been accounted for.
Using big-data to explore the nature of the oxygen dissociation distribution
We sought to use big data from a large population of patients to examine this relationship in “real-life settings”. Collecting over 100,000 blood gas samples taken from critically-ill children admitted to the intensive care unit at the Hospital for Sick Children (Sickkids) in Toronto we explored the nature of the relation between pO2 and SO2.
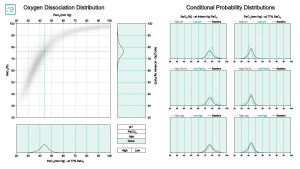
This app presents the Oxygen Dissociation Distribution: A Two-dimensional distribution relating pO2 and SO2 derived from 112,101 blood gas tests, bin size 1 mmHg by 1%. Probability density presented using a gray colormap. Using the mouse cursor, the partial conditional distributions of pO2 at a given SO2 value and vice versa can be explored.
We also allow testing the effects of PH, PCO2 and age on the oxygen dissociation distribution. In order to isolate the effects of either pH or pCO2 on the dissociation distribution, when testing for example the effects of pCO2, we only included patients that had a normal pH (7.35-7.45) and similarly when testing the effects of pH we only included patients with a normal pCO2 (35-45mmHg). For ease of presentation, distributions were smoothed using a 2-D Gaussian smoothing kernel with standard deviation of one.
Read the publication online at https://link.springer.com/article/10.1007%2Fs00134-019-05792-x
View the chart online at http://media.laussenlabs.ca/figures/oxygen-dissociation/